La Importancia de la Valoración del Estado Nutricional en la Detección de Individuos en Riesgo Metabólico
|
Cintia Amaral Montesino[1] cintia.amaral@udem.edu https://orcid.org/0000-0002-8119-6046 Universidad de Monterrey México |
Claudia Cecilia Radilla Vázquez cradilla@correo.xoc.uam.mx https://orcid.org/0000-0001-9161-1904 Universidad Autónoma Metropolitana Unidad Xochimilco México |
|
Andrea Abrego Sánchez andrea.abrego@udem.edu https://orcid.org/0000-0003-0846-0194 Universidad de Monterrey México |
Mónica Alejandra Díaz Granados monica.diaz@udem.edu https://orcid.org/0000-0003-1769-7716 Universidad de Monterrey México |
|
Olga Carolina Rojas García https://orcid.org/0000-0001-7717-7072 Universidad Autónoma de Nuevo León Universidad de Monterrey México
|
|
RESUMEN
La obesidad afecta a una gran parte de la población mundial. metabólico La evaluación nutricional en la población se ha convertido en una herramienta útil para detectar sujetos en riesgo. Método: Estudio transversal y descriptivo con 69 adultos trabajadores de la educación. Se realizaron mediciones antropométricas y sanguíneas de Glucosa, Insulina, HbA1c, Perfil Lipídico, Interleucina 6. Para el análisis estadístico se utilizó el Programa Prism Graph Pad versión 9.5.1 del año 2023. Resultados: El grupo control estuvo formado por 14 sujetos (20.28%) con IMC normal. Un grupo de 22 sujetos (31.88%) con sobrepeso. Un grupo de 33 (47.82%) sujetos con obesidad. Se detectó hipercolesterolemia en el 42.02% de los sujetos, alteraciones en la LDL en el 69.5% y niveles bajos de HDL en el 42.02%, siendo el 45.76% en mujeres y el 20% en hombres. La hipertrigliceridemia estuvo presente en el 37.68% de la población, el 59.42% de los sujetos presentó alteraciones de la circunferencia de la cintura, el 63.76% tuvo el índice cintura-cadera superior a 0,8 para las mujeres y 0,9 para los hombres y el 84% presentó el índice cintura-talla (WCI)) > 0,5. Conclusiones: El IMC y el porcentaje de grasa corporal deben combinarse para detectar individuos en riesgo metabólico.
Palabras clave: evaluación nutricional; obesidad; IMC; porcentaje de grasa; sobrepeso
The Importance of Nutritional Status Assessment in the Detection of Individuals at Metabolic Risk
ABSTRACT
Obesity affects a large part of the world's population. Nutritional evaluation in the population has become a useful tool to detect subjects at metabolic risk. Method: Cross-sectional and descriptive study with 69 adult education workers. Anthropometric and blood measurements of Glucose, Insulin, HbA1c, Lipid Profile, Interleukin 6 were performed. For statistical analysis, the Prism Graph Pad Program version 9.5.1 of 2023 was used. Results: The control group was made up of 14 subjects (20.28 %) with normal BMI. A group of 22 subjects (31.88%) with overweight. A group of 33 (47.82%) subjects with obesity. Hypercholesterolemia was detected in 42.02% of the subjects, alterations in LDL in 69.5% and low HDL levels in 42.02%, with 45.76% in women and 20% in men. Hypertriglyceridemia was present in 37.68% of the population, 59.42% of the subjects presented alterations in waist circumference, 63.76% had a waist-hip index greater than 0.8 for women and 0.9 for men. men and 84% had waist-height index (WCI) > 0.5. Conclusions: BMI and body fat percentage should be combined to detect individuals at metabolic risk.
Keywords: assessment; nutritional; obesity; BMI; fat percentage; overweight
Artículo recibido 25 noviembre 2023
Aceptado para publicación: 30 diciembre 2023
INTRODUCTION
Obesity, which would be considered a low-level inflammatory condition, is a pro inflammatory state with hypertrophy and hyperplasia of adipocytes related to metabolic and cardiovascular disorders, such a type 2 diabetes, hypertension, atherosclerosis, dyslipidemia, and accurate and chronic inflammatory process. The prevalence of obesity shows increasingly high numbers. It is estimated that in 2030, there will be a worldwide increase of 25% and 32% of overweight and obesity respectively. Nutritional status, lifestyle, and associated nutritional biomarkers are used in clinical studies to predict future events (Kuhnle G, 2012). Accurate and valid assessment of body composition is essential to determine nutritional status, since it will allow the identification of relevant measures that can contribute to the planning and effectiveness of current and future nutritional intervention (Smith S and Madden AM, 2016).
According to the last Nacional Health and Nutrition Survey carried out in 2018 (ENSANUT 2018) (Romero-Martínez M et al, 2018) the prevalence of abdominal obesity in Mexican adults was 65.4% for men and 87.7% for women. It is known that obesity increases the risk of diabetes mellitus. ENSANUT 2022 presents national figures that reflect that of Mexican adult population, 69.7% are overweight (37.8%) or obese (31.8%). In 2021, 15.8% of adults had type 2 diabetes mellitus and 36% of them did not know it (Romero-Martínez M et al, 2023).
Particularly in healthy young adults in Mexico, researchers have found that abdominal obesity is the most prevalent component of the metabolic syndrome (Moreira P et al, 2013). This is because white adipose tissue produces cytokines or adipocytokines involved in this process (Oliveira T et al, 2014). Healthy participants who experience an increase in glucose and postprandial plasma triglycerides also experience an excess generation of reactive oxygen species that initiate the proinflammatory response. With time the continuous elevation of glucose and triglycerides alters the balance of the inflammatory mediator, followed by metabolic disturbances, such as vascular endothelial dysfunction, insulin sensitivity, and elevation of plasma lipids, facilitating the development of metabolic syndrome (Canto-Osorio F et al, 2020). Their presence indicates the high risk of these individuals to develop type 2 diabetes mellitus, cognitive decline nephropathy and cardiovascular disease.
The evaluation of nutritional status is a widely used tool for the identification of overweight, obese, and malnourished subjects in populations. It is called an ABCDE assessment. It encompasses the multifactorial analysis and interpretation that allows the early detection of individuals with metabolic risk. Anthropometrics, biochemistry, diet, clinical status, and the environment of each subject are evaluated. This evaluation makes it possible to determine the nutritional status of an individual or group (Guamialamá J et al, 2019) (Shukohifar M et al, 2022). It is of vital importance to carry out the prevention and programming of interventions that allow improving habits and combating obesity (Bencomo MN et al, 2011).
The metabolic impact of fat deposits is directly related to their location. The subcutaneous fat of the abdominal region is located immediately below the skin, it is found in the lower segment in the femoral and gluteal regions. For its part, visceral fat is contained in the internal part, wrapping the abdominal organs and its accumulation is related to a greater metabolic and atherothrombotic risk. Its accumulation is different according to sex (Canto-Osorio F et al, 2020) (Godínez S et al, 2002) (Fahed G et al,2022).
The objective of this study was to determine the nutritional status of education workers and detect individuals at metabolic risk through anthropometric measurements and biochemical examinations, as well as to establish the correlation between BMI and body fat percentage and between BMI and visceral fat in this population, to go deeper, they demonstrate that the waist/height ratio is an important indicator of metabolic risk.
MATERIALS AND METHODS
This cross-sectional and descriptive study was developed in basic education schools located in the municipality of Santa Catarina, Nuevo Leon, Mexico. It took place from May to July 2022. A total of 69 adults between 18 and 78 years of age, workers in educational centers without a diagnosis of diabetes, autoimmune diseases, dyslipidemia, or cardiovascular diseases were included. Study participants could not be pregnant or lactating, had not been part of any weight loss program in the last 6 months, or had not taken weight loss medications. All subjects interested in participating signed the informed consent. This research was approved by the Ethics Committee of the Universidad Internacional Iberoamericana (UNINI). Complied with the ethical standards contained in the Declaration of Helsinki. A structured instrument was designed to carry out the anamnesis of each participant, evaluate their nutritional status, medical history, food allergies and intolerances, medication. Likewise, they underwent an anthropometric biochemical and blood pressure study after accepting their participation.Anthropometric measurements such as weight and height, waist, hip and wrist circumferences, percentage of body fat and visceral fat as well as blood pressure were taken according to the standard procedures described by the World Health Organization (WHO). To determine body weight, a Tanita Fitscan BC-533 brand body analyzer scale was used. A Seca 213 portable stadiometer was used to measure height. The Body Flex anthropometric tape (Sana Flex) was used to determine perimeters. Blood pressure was determined with a Beurer® BM-35 automatic sphygmomanometer. Blood determinations of Glucose, Insulin, Glycosylated Hemoglobin (HbA1c), Lipid Profile that involves: LDL, HDL, VLDL, Triglycerides, Total Cholesterol as well as Interleukin 6 were performed. This analysis was performed at the Clinical Analysis Laboratory of the University of Monterrey, Nuevo León. A Fujifilm Drychem NX 500i Clinical Chemistry Analyzer was used to determine glucose and lipid parameters. For the quantitative measurement of hemoglobin A1c (HbA1c) levels, the Labonacheck equipment was used. To determine the levels of Insulin and Interleukin 6, the Immulite 1000 equipment was used. For the statistical analysis, the Prism Graph Pad Program version 9.5.1 of the year 2023 was used. The measures of central tendency such as the mean, standard deviation, minimum and maximum of each quantitative variable were determined. These values are shown in Table 1. The level of statistical significance considered was p=0.05 and p<0.05. The Kolmogorov-Smirnov test with the Lilliefors modification, the one-way ANOVA test, the Kruskal Wallis test, and the Dunn post-hoc test were used to carry out this type of analysis.
RESULTS
A total of 69 participants, 59 women (85.50%) and 10 men (14.49%) were included in the study. The mean age of the participants was 43 years old. Three groups were formed according to the BMI values reported by the WHO, obesity was diagnosed with BMI ≥30 kg/m2, overweight, BMI ≥25 kg/m2 and normal BMI, BMI ≥ 18 to 24.9 kg/m2 for both genders. The control group with normal BMI was formed by 14 subjects (20.28%), the overweight group was constituted by 22 subjects (31.88%) and an obese group had 33 subjects (47.82%), as shown in Graph 1. Within this last group we found 15 subjects with grade I obesity with a BMI between 30-34 Kg/m2, 12 subjects with grade II obesity with a BMI of 35-39.9 and 6 subjects with grade III obesity with a BMI >= 40. Table 1 describes the statistical behavior of the variables in each BMI group analyzed and compared to the normal BMI control group.Dyslipidemias such as hypercholesterolemia (total cholesterol >200 mg/dl) were detected in 42.02% of the subjects, alterations in LDL levels (LDL >100 mg/dl) in 69.5%, low HDL levels in 42.02% of all the population, (HDL women <50 mg/dl), being 45.76% in women, and in men 20% these presented HDL figures <40 mg/dl. Hypertriglyceridemia (TAG >150 mg/dl) was also present in 37.68% of the studied population.Glucose metabolism is also impaired in some of the subjects. 5.79% (n=4) of the population present fasting glucose above 100 mg/dl. 2 diabetic subjects with glucose above 126 mg/dl were detected. 13.04% (n=9) of the population have hyperinsulinemia, 15.94% (n=11) have insulin resistance, and of these, 9 subjects have the highest levels of insulin. Glycated hemoglobin is above 5.6 in 17.39% (n=12) of the subjects and 3 of them are above 6.5%. Regarding anthropometry, 59.42% of the participants presented altered values of waist circumference (women > 88 cm, men > 102 cm), 63.76% of these presented the waist-hip index above 0.8 for women and 0.9 for men and 84% presented the waist-height index (WCI) > 0.5, which indicates that the metabolic risk in the group of subjects analyzed is high. It was also detected that in the group of overweight patients (n=22), 14 people present high body fat percentage values as in the obesity range (more than 35% in women and more than 25% in men) corresponding to the 63.6%. In the normal BMI group, 1 person was found to have very high level of fat percentage as in obesity, these results suggest that the BMI should not be used as the only criterion to detect if there is overweight or obesity but should be combined with criteria that measure adipose tissue as percentage body fat and visceral fat.Regarding the amount of visceral fat, we could see that there are 11 subjects with very high values (> 13), corresponding to 15.94%, of which 6 subjects present grade II obesity and 5 grade III obesity.The Table 1 shows the descriptive statistics of the most important anthropometric variables analyzed, it can be noted that all of them are significantly different except the waist/hip ratio. The magnitudes determined by the post hoc Dunn Test are also shown and allow us to appreciate the differences that exist when comparing the Control - Overweight and Control - Obesity groups. The difference that can be noticed is more significant (P=<0.0001 ****) when the comparison is made between the control group and the group with obesity in parameters such as visceral fat, waist circumference, hip circumference, waist index height, and body fat percentage.
Table 1. Anthropometric characteristics of the groups according to BMI (normal, overweight, obese)
|
BMI ≥ 18 to 24.9 kg/m2Normal- control |
BMI ≥25 kg/m2 to 29.9 Kg/m2- Overweight |
BMI ≥30 kg/m2Obesity |
BMI |
|||
Subjects |
14 |
22 |
33 |
|
Minimum |
20.54 |
25.5 |
30.4 |
Median |
23.53 |
27.57 |
35.1 |
Maximum |
24.57 |
30 |
48.9 |
|
Std. Deviation |
1.071 |
1.395 |
4.944 |
|
One way ANOVA test |
P<0.0001 **** |
||
|
Dunn |
Control (n = 14) vs. Overweight (n =22) P=0.0011 **
|
Control (n = 14) vs. Obesity (n = 33) P=<0.0001****
|
Sobrepeso (n =22) vs. Obesidad (n = 33) P=<0.0001**** |
VISCERAL FAT |
|||
Minimum |
2 |
3 |
6 |
Median |
5.5 |
8 |
11 |
Maximum |
7 |
11 |
23 |
|
Std. Deviation |
1.569 |
2.133 |
3.595 |
|
Kruskal Wallis Test P value |
P<0.0001 **** |
||
|
Dunn |
Control (n = 14) vs. Overweigth (n =22) P=0.0427 * |
Control (n = 14) vs. Obesity (n = 33) P=<0.0001 **** |
|
WAIST CIRCUMFERENCE |
|||
Minimum |
69 |
76 |
84 |
Median |
81.5 |
89.5 |
99 |
Maximum |
94.5 |
109.5 |
134 |
|
Std. Deviation |
7.541 |
9.224 |
13.96 |
|
Kruskal Wallis Test P value |
P<0.0001 **** |
||
|
Dunn |
Control (n = 14) vs. Overweight (n =22) P=0.0468 * |
Control (n = 14) vs. Obesity (n = 33) P=<0.0001 **** |
|
HIP CIRCUMFERENCE |
|||
Minimum |
93 |
98 |
99 |
Median |
97.95 |
103 |
118 |
Maximum |
104.5 |
113 |
145 |
|
Std. Deviation |
3.381 |
4.927 |
11.09 |
|
One way ANOVA test |
P<0.0001 **** |
||
|
Dunn
|
Control (n = 14) vs. Overweight (n =22) P=0.0418 * |
Control (n = 14) vs. Obesity (n = 33) P=<0.0001 **** |
|
WAIST HIP INDEX |
|||
Minimum |
0.74 |
0.76 |
0.75 |
Median |
0.82 |
0.855 |
0.86 |
Maximum |
0.95 |
1.01 |
1 |
|
Std. Deviation |
0.06634 |
0.07973 |
0.07036 |
|
One way ANOVA test |
P=0.3028 ns |
||
|
Dunn |
Control (n = 14) vs. Overweight (n =22) P=0.3779 ns |
Control (n = 14) vs. Obesity (n = 33) P=0.2491 ns |
|
WAIST INDEX HEIGHT |
|||
Minimum |
0.4118 |
0.475 |
0.5316 |
Median |
0.5 |
0.5697 |
0.6392 |
Maximum |
0.587 |
0.6474 |
1 |
|
Std. Deviation |
0.04026 |
0.05087 |
0.09422 |
Kruskal Wallis Test P value |
P<0.0001 **** |
||
|
Dunn
|
Control (n = 14) vs. Overweight (n =22) P=0.0323 * |
Control (n = 14) vs. Obesity (n = 33) P=<0.0001 **** |
|
BODY FAT PERCENTAGE |
|||
Minimum |
15.4 |
20 |
25.8 |
Median |
24.7 |
36 |
44.5 |
Maximum |
36.6 |
45.9 |
54.9 |
|
Std. Deviation |
7.533 |
6.424 |
5.838 |
Kruskal Wallis Test P value |
<0.0001 **** |
||
|
Dunn |
Control (n = 14) vs. Overweight (n =22) P=0.0413 * |
Control (n = 14) vs. Obesity (n = 33) P=<0.0001 **** |
|
Figure 1. Comparison according to Dunn's Test of the Control, Overweight and Obesity Group in the anthropometric variables analyzed shows that there is a significant difference when comparing the 3 groups formed according to BMI, overweight control (P=0.0011**), obese control ((P=<0.0001****), overweight and obesity ( P=<0.0001****), however in the percentage of body fat and in the amount of visceral fat there is a greater significant difference between the control group with obesity. As for the indices, in the waist/waist ratio there is no significant difference between the groups and in the waist/height ratio the difference between normal BMI and obesity is also greater.
Figure 1. Comparison according to Dunn's Test of the Control, Overweight and Obesity Groups in the anthropometric variables analyzed
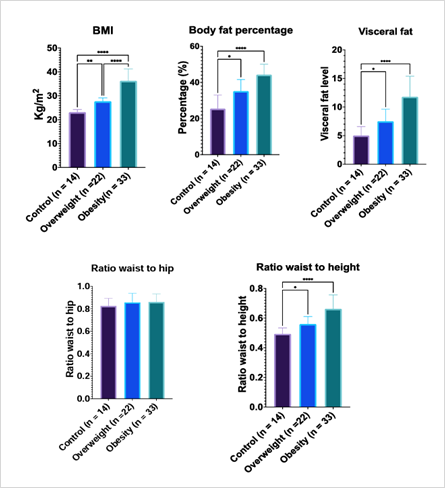
The results of the post hoc Dunn Test are shown, which makes it possible to establish comparisons between the BMI overweight and obesity groups vs the control and to define which differences are more significant between the groups. Dunn's test performs pairwise comparisons between each independent group and indicates the groups that are statistically significantly different at some α level. Control (n = 14) vs. Overweight (n =22), Control (n = 14) vs. Obesity (n = 33). BMI, Body fat percentage, Visceral fat, Radio waist to hip, Ratio waist to height.
The correlations between the variables are shown in Figure 2. It shows the existence of an intense and significant relationship between the BMI with visceral fat, with the waist and hip circumference, with the waist-height index and with the percentage of body fat. It is analyzed that there is a marked slope in the line, that the points are concentrated approximately on the line and that the values of Spearman's r are also high. If the BMI increases, the hip circumference increases 0.9277 times, the waist-height index 0.8437 times and the visceral fat 0.8389 times, the waist circumference 0.8155 times, indicating their directly proportional relationship, which indicates the need to reduce the amount of visceral fat to improve general health.Figure 2. Correlation between body mass index and anthropometric variables
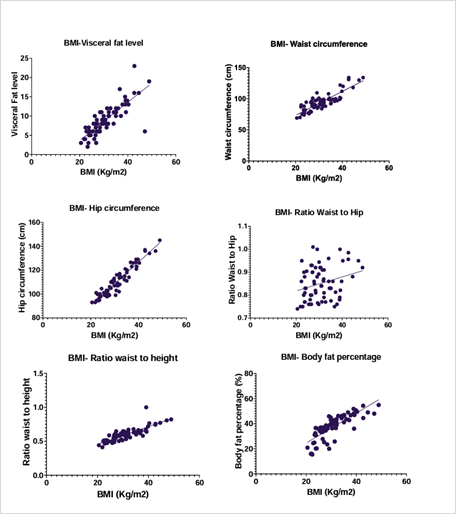
In Figure 2. Correlation between body mass index and anthropometric variables shows the correlations between body mass index (BMI) and other anthropometric variables. Existing correlations between body mass index (BMI) vs visceral fat (r=0.8389,P<0.0001****), BMI vs Waist circumference (r=0.8155, P<0.0001 ****), BMI vs Hip circumference (r=0.9277, P<0.0001 ****), BMI vs Waist hip index (r=0.2699, P=0.0249 *), BMI vs Waist index height (r=0.8437, P<0.0001 ****), BMI vs Body fat percentage (r=0.7999, P=<0.0001 ****). There is a correlation between BMI and all variables except BMI vs waist-hip ratio. The existing correlation is manifested when increasing the value of the BMI increases proportionally the value of the analyzed variable.
Table 2 shows the descriptive statistics of the biochemical parameters that resulted in significant and insignificant differences. It is seen that the measurements of Insulin and HOMA index are moderately significant. In the case of VLDL and TAG levels, these were also significant, indicating the existence of alterations in lipid metabolism. It can be noted that the level of significance is lower if we compare them with that of the anthropometric variables.Table 2. Biochemical parameters of the groups according to BMI (normal, overweight, obese)
|
BMI ≥ 18 to 24.9 kg/m2Normal- control |
BMI ≥25 kg/m2 to 29.9 Kg/m2- Overweight |
BMI ≥30 kg/m2Obesity |
Insuline |
|||
Minimum |
2.08 |
1.9 |
1.9 |
Median |
7.675 |
10.45 |
13.6 |
Maximum |
23 |
21.6 |
58.2 |
|
Std. Deviation |
6.434 |
5.357 |
12.28 |
Kruskal Wallis test |
P= 0.0077 ** |
||
Dunn test |
Control (n = 14) vs. Overweight (n =22) P>0.9999 ns |
Control (n = 14) vs. Obesity (n = 33) P= 0.0257 * |
|
HOMA - IR |
|||
Minimum |
0.4 |
0.41 |
0.36 |
Median |
1.53 |
2.095 |
3.06 |
Maximum |
5.56 |
5.17 |
30.87 |
Std. Deviation |
1.531 |
1.238 |
6.923 |
Kruskal Wallis test |
P= 0.0097 ** |
||
Dunn test |
Control (n = 14) vs. Overweight (n =22) P>0.9999 ns |
Control (n = 14) vs. Obesity (n = 33) P=0.0257 * |
|
VLDL |
|||
Minimum |
9 |
11 |
12 |
Median |
21.5 |
27 |
31 |
Maximum |
45 |
47 |
48.6 |
Std. Deviation |
10.07 |
9.824 |
9.046 |
One way ANOVA test |
P=0.0162 * |
||
Dunn test |
Control (n = 14) vs. Overweight (n =22) P=0.3294 ns |
Control (n = 14) vs. Obesity (n = 33) P=0.0106 * |
|
TAG |
|||
Minimum |
45 |
30.3 |
70 |
Median |
106.5 |
136 |
154 |
Maximum |
225 |
243 |
243 |
Std. Deviation |
50.76 |
57.95 |
44.64 |
One way ANOVA test |
P=0.0255 * |
||
Dunn test |
Control (n = 14) vs. Overweight (n =22) P=0.3186 ns |
Control (n = 14) vs. Obesity (n = 33) P=0.0155 * |
|
Glycated Hemoglobin |
|||
Minimum |
4.3 |
3.9 |
4.3 |
Median |
4.7 |
5 |
5.1 |
Maximum |
5.8 |
6.3 |
7.2 |
Std. Deviation |
0.3995 |
0.5585 |
0.7422 |
Kruskal Wallis test |
P= 0.0737 ns |
||
Dunn test |
Control (n = 14) vs. Overweight (n =22) P=0.2232 ns |
Control (n = 14) vs. Obesity (n = 33) P=0.0452 * |
|
LDL |
|||
Minimum |
81 |
80 |
62 |
Median |
113 |
112 |
115 |
Maximum |
159 |
199 |
209 |
Std. Deviation |
25.9 |
29.07 |
27.65 |
One way ANOVA test |
0.9833 ns |
||
Dunn test |
Control (n = 14) vs. Overweight (n =22) P=0.9998 ns |
Control (n = 14) vs. Obesity (n = 33) P=0.9886 ns |
|
HDL |
|||
Minimum |
29 |
39 |
22 |
Median |
46 |
52.5 |
41.62 |
Maximum |
91 |
78.03 |
79 |
Std. Deviation |
16.42 |
13.11 |
11.91 |
Kruskal Wallis test |
P=0.0766 |
||
Dunn test |
P=0.7962 ns |
P=0.6005 ns |
|
IL-6 |
|||
Minimum |
1.9 |
1.53 |
1.5 |
Median |
3.065 |
3.265 |
4.11 |
Maximum |
8.95 |
26.7 |
17.3 |
Std. Deviation |
2.278 |
5.337 |
3.703 |
Kruskal Wallis test |
P=0.3535 ns |
||
Dunn test |
P>0.9999 ns |
0.5294 ns |
|
Glucose |
|||
Minimum |
73 |
65 |
63 |
Median |
84 |
84.5 |
83 |
Maximum |
100 |
97 |
215 |
Std. Deviation |
8.899 |
8.225 |
26.51 |
Kruskal Wallis test |
P=0.9885 ns |
||
Dunn test |
P>0.9999 ns |
P>0.9999 ns |
|
Atherogenic Index |
|||
Minimum |
1.8 |
1.9 |
1.9 |
Median |
3.9 |
3.67 |
4.35 |
Maximum |
5.69 |
5.38 |
7.1 |
Std. Deviation |
1.196 |
1.007 |
1.194 |
One way ANOVA test |
P=0.0615 ns |
||
Dunn test |
P=0.9889 ns |
P=0.1418 ns |
|
Cholesterol |
|||
Minimum |
76 |
100.9 |
115 |
Median |
184.5 |
188 |
195 |
Maximum |
245 |
329 |
304 |
Std. Deviation |
45.22 |
49.99 |
33.04 |
One way ANOVA test |
P=0.5952 |
||
Dunn test |
P=0.5952 ns |
P=0.6929 ns |
|
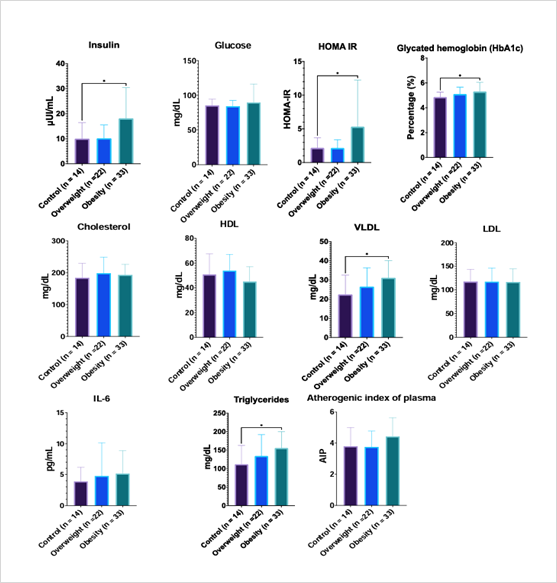
In Figure 3. Comparison according to Dunn's Test of the Control, Overweight and Obesity Group in the biochemical variables analyzed. The results of the post hoc Dunn Test are shown, which allows comparisons to be made between the BMI overweight and obesity groups vs. control and define which differences are most significant. Control (n = 14) vs. Overweight (n = 22), Control (n = 14) vs. Obesity (n = 33). Insulin, Glucose, HOMA-IR, Glycosylated Hemoglobin, Triglycerides, VLDL, LDL, HDL, IL6, Atherogenic Index, Cholesterol. The significance between the values of the control group and the obesity group can be noted in the measurements of Insulin, Glycosylated Hemoglobin, VLDL and TAG.
Figure 3. Comparison according to Dunn's Test of the Control, Overweight and Obesity Groups in the biochemical variables analyzed
In Figure 4. Correlation between body mass index and biochemical variables, shows the biochemical parameters that had a higher level of correlation, highlighting BMI vs insulin (0.3729) and BMI vs HOMA IR (0.3717), these being moderately significant. It is important to note that the correlation between the BMI and the biochemical parameters is much lower if we compare it with that between the BMI and the anthropometric variables analyzed. Existing correlations between body mass index (BMI) and variables. BMI vs Insulin (r=0.3729, P=0.0016 **), BMI vs HOMA IR (r=0.3717, P=0.0017 **), BMI vs Glycated hemoglobin (r= 0.2195, P= P=0.0699 ns), BMI vs VLDL (r=0.2481, P=0.0398 *), BMI vs Triglycerides (r=0.2302, P= P=0.057 ns), BMI vs Atherogenic index of plasma (r=0.2035, P=0.0935 ns) . In addition, 21 subjects with Metabolic Syndrome with 3 or more altered diagnostic criteria were detected.
Figure 4. Correlation
between body mass index and biochemical variables
DISCUSSION
Cardiovascular diseases are currently the first cause of death and disease in many countries regardless of the level of development, including Mexico. The waist-height ratio (WTI) has been suggested as a predictor of higher cardiovascular risk, which is directly related to the distribution of fat in the abdominal area and height, as well as total cholesterol and triacylglycerol levels. In the study carried out, we found that 58 out of 69 subjects presented waist-height index (WCI) figures above 0.5, representing 84% of the studied population, 44 of them have altered LDL values. Other authors have obtained similar results. Muñoz 2016 reports, that analyzing the body composition of 170 workers in Chihuahua, the identification of more than two thirds of the subjects with excess weight and three quarters presented ICT > 0.50, was strongly associated with alterations in the recognized predictors of cardiovascular damage such as hypertriglyceridemia, LDL and fasting hyperglycemia (Shukohifar M et al, 2022). Cruz, 2015 in his study of anthropometric assessment in health personnel (n=2600) found that 68% of the workers studied presented altered ICT. These results support the diagnostic utility of ICT (Cruz-Domínguez M et al, 2015).
The most common dyslipidemias that were detected in the participants of our study were Hypercholesterolemia (42.02%), Triacylglycerolemia (37.68%), low HDL cholesterol (42.02%), and high LDL cholesterol (69.5%), these coincide with the most prevalent dyslipidemias currently at Mexico according to Ensanut 2022 (Romero-Martínez et al, 2023).
Body composition is defined as a key measurement in biomedical science, it is responsible for the quantification of body components and impacts on general health (Bauce G et al, 2019) (González-Chávez A et al, 2008). Gasperín-Rodríguez, E. et al examined the body composition of the participants in their study using bioimpedance. They considered that the BMI is not a magnitude that differentiates body composition and that it does not contemplate the percentage of body fat that is directly related to obesity (Gasperín-Rodríguez EI et al, 2022). This coincides with our results, in his study a high correlation was established between the BMI variables and percentage of body fat (r= 0.81), the same thing that has happened in our research (r= 0.7999). Padilla 2014 considers that the indicators that quantify adipose tissue and estimate the percentage of body fat are those that can most accurately predict obesity (Ryder E et al, 2014) (Padilla J, 2014). Bernarek 2022 refers that body fat, especially visceral fat, is one of the causes of the increasing prevalence of existing hypertension, fatty liver, insulin resistance, dyslipidemia, and type 2 diabetes mellitus, so its determination is very important (Bednarek AM et al, 2022).
The WHO states that "in order to correctly diagnose obesity, in addition to verifying a high weight, assess whether this is due to an increase in fat mass, for this we have to analyze body composition" (Padilla, J, 2014). The usefulness of the BMI as a gold standard to detect overweight and obesity is currently widely discussed. Moreno, 2007 states that the exclusive use of the BMI masks important nutritional pathologies, both by default and by excess (Moreno-Romero S, 2007). Bautista, M. reports that the BMI, although it has been used to measure obesity, does not consider the amount of body fat and its distribution, nor does it discriminate between fat-free mass and fat mass, which is why it presents limitations to classify the subjects analyzed (Bautista M et al, 2020). This can be affected by the muscularity of the subject, the amount of fat and the fluid distribution. In the previous investigation, obesity was detected from anthropometric measurements of waist circumference, weight, and height, body mass index was calculated, and percentage of body fat was determined, just as we did in our study. The BMI showed a high correlation with the waist circumference (WC) in both studies, which indicates that the analysis of both measurements together can predict the risk of cardiovascular diseases. Shuying Li, et al states that the percentage of body fat and visceral fat are variables that are linked to metabolism, which have marked clinical significance in the assessment of obesity and are more accurate than BMI or waist circumference by themselves since they determine amount of fat (Shuying Li et al, 2022). Del Moral 2021, reported that the BMI presents a strong association with the percentage of body fat in his study with 3869 Mexican university students, which is why he suggests combining both for the determination of obesity (del Moral-Trinidad L, 2021).
The condition denoted as Obesity of normal weight (OPN) is closely related to the current questions about the efficacy of the BMI, since it applies to people who are of normal weight according to the BMI but nevertheless present an increase in body fat in ranges of obesity, in addition to having an unfavorable lipid profile and an altered inflammatory profile (Torres ZA,2020). These subjects must be warned that their state of health is not normal, since they generally assume that everything is correct, which can have unfavorable long-term consequences. Salazar reports that an increase in BMI has been associated with decreased psychological well-being, low self-esteem, and reduced social integration (Salazar J et al, 2016). Bautista et al, 2020 reported the existence of subjects who present obesity of normal weight (OPN) and who go unnoticed when considering only the BMI (Bautista M et al, 2020). 43.8% (n=175) presented an underdiagnosis due to BMI in this study, since they are in a normal weight category (7.8%) or overweight (36%) but fall into an obesity category according to the %BF, demonstrating the limitation of the BMI for the detection of alterations (Bautista M et al, 2020). In our study, a similar behavior took place, in the group of 22 subjects classified as overweight, we found that 14 of them had a high body fat percentage and framed in obesity ranges, so if only the BMI were analyzed, these would not be detected and would be at metabolic and cardiovascular risk. The existence of 1 subject with Obesity of normal weight (OPN) was identified within the normal weight control group of 14 subjects that we had in the study.
Martínez, 2015 comments that the BMI cannot be used in muscular people to determine if they are obese, since it is common for them to have a low or extremely low fat percentage and a high weight due to the development of lean mass, since this criteria is not taken into consideration, subjects could be classified as false positives, that is, identifying them as obese when they are not (Martínez A et al, 2015). Based on what has been analyzed, we can reaffirm that BMI presents limitations for all subjects and that it must be combined with %FG, CC, and Visceral Fat to achieve a correct diagnosis (Shuying Li et al, 2022) (Domínguez et al, 2012)( Pajuelo J et al, 2019).
Pajuelo, 2019 carried out a study where the BMI was used together with the waist circumference to detect subjects at risk, being consistent with what was previously discussed regarding the fact that the BMI should not be considered as the only diagnostic criterion (Pajuelo J et al, 2019). In our study, 59.42% of the participants presented altered values of waist circumference according to the different cut-off values by sex.Bauce et al compared the means of the variables by sex and significant differences were obtained for weight, height, IPCC and % GC (Bauce G et al, 2019). In our study, significant differences were obtained in BMI, percentage of body fat, amount of visceral fat and waist/height index, however the waist-hip index did not behave in the same way since it did not present a significant difference.
Bauce et al states that high correlations were obtained between WC- Weight (0.98); WC-BMI (0.93); CC-%CG (0.89); Height-BMI-%GC (0.85) and BMI-Weight (0.84); Weight-Height (0.81) and WC-Height (0.71) (18). In our case, high correlations were also obtained between BMI- Visceral fat (0.8389), BMI- Hip Circumference (0.9277), BMI- Waist-height index (0.8437), BMI- Percentage of body fat (0.7999) and BMI- Waist circumference (0.8155) but low correlation between BMI and waist-hip ratio (0.2699) (Bauce G et al, 2019).
It is well known that obesity is a major risk factor for developing type 2 diabetes because fat accumulations can affect insulin action, together with the presence of dysfunctional pancreatic beta cells and insulin resistance. Shuying Li, 2022 reports in his study that BMI was linearly correlated with the risk of DM2, in addition that visceral fat influences blood glucose levels (Shuying L et al, 2022). Our study detected the presence of 2 diabetic subjects with fasting glucose above 126mg/dl, 13.04% with hyperinsulinemia, 15.94% with insulin resistance and 3 with glycosylated hemoglobin above 6.5%. It was also found that the correlations between BMI and HOMA and Glycated Hemoglonin were low, although the difference was significant for Insulin and the HOMA index, which is shown below: BMI vs Insulin (r=0.3729, P=0.0016 * *), BMI vs HOMA IR (r=0.3717, P=0.0017 **), BMI vs Glycated hemoglobin (r= 0.2195, P= P=0.0699 ns). Shuying Li 2022 demonstrated that waist circumference and BMI were positively correlated with HbA1c in people without diabetes (Shuying L et al, 2022). Bernarek 2022 states that there is a greater probability of developing diabetes in hypertensive women as the BMI, waist circumference and body fat increase, but that the increase in BMI and waist circumference constitute an important risk factor for the development of type 2 DM for men and women (Bednarek A et al, 2022). In our case, the correlations between BMI and blood biochemistry resulted in lower values, BMI vs Insulin (r=0.3729, P=0.0016 **), BMI vs HOMA IR (r=0.3717, P=0.0017 **), BMI vs Glycated hemoglobin (r= 0.2195, P= P=0.0699 ns), BMI vs VLDL (r=0.2481, P=0.0398 *), BMI vs Triglycerides (r=0.2302, P= P=0.057 ns), BMI vs Atherogenic index of plasma (r=0.2035, P=0.0935 ns). The descriptive statistics of the biochemical parameters resulted in significant and insignificant differences. It can be seen that the measurements of Insulin and HOMA index are moderately significant. In the case of VLDL and TAG levels, these were also significant, indicating the existence of alterations in lipid metabolism.
CONCLUSIONS
Obesity affects a large part of the world's population. The majority of these individuals may be at metabolic risk, a situation that must be raised aware and taken into account due to its direct relationship with diabetes and cardiovascular diseases, which are the leading cause of current death in many countries.Nutritional evaluation in the population has become a necessary, useful and easy-to-implement tool to detect subjects at metabolic risk. This evaluation includes the analysis of the individual's body composition with the quantification of body components and their impact on health as well as the biochemical analysis of blood samples that allow determining parameters that alter metabolism.The BMI should not be used as the only criterion or gold standard to diagnose overweight or obesity due to its limitations since it does not contemplate the measurement of fat and its distribution, which is why it is necessary to combine it with the percentage of body fat or with the levels of visceral fat, which will allow a better evaluation of body composition and in turn greater prevention of comorbidities.The nutritional assessment of populations can be considered as a high-impact exercise that not only involves the detection of overweight or obese subjects but also allows the identification of subjects who have normal weight obesity and who must be notified, malnutrition, malabsorption or other metabolic problems.
BIBLIOGRAPHIC REFERENCES
Al-Zurfi, B. M. N., Abd Aziz, A., Abdullah, M. R., & Noor, N. M. (2012). Waist height ratio compared to body mass index and waist circumference in relation to glycemic control in Malay type 2 diabetes mellitus patients, Hospital Universiti Sains Malaysia. International Journal of Collaborative Research on Internal Medicine & Public Health, 4(4), 406.
Baile, J. I. (2015). ¿Es válido el uso del Índice de Masa Corporal para evaluar la obesidad en personas musculosas?. Nutricion hospitalaria, 32(5), 2353-2354.
Bauce, G. J., & Moya-Sifontes, M. Z. (2019). Relación entre porcentaje de grasa corporal y otros indicadores antropométricos de obesidad en adultos con hígado graso. Revista Digital de Postgrado, 8(1), 1.
Bednarek, A. M., Owczarek, A. J., Chudek, A., Almgren-Rachtan, A., Wieczorowska-Tobis, K., Olszanecka-Glinianowicz, M., & Chudek, J. (2022). The Prevalence of Diabetes among Hypertensive Polish in Relation to Sex-Difference in Body Mass Index, Waist Circumference, Body Fat Percentage and Age. International Journal of Environmental Research and Public Health, 19(15), 9458.
Bencomo, M. N., Fernández, N. D., Rivas, A. T. B., & Blanco, M. R. (2011). Factores de riesgo de obesidad y sobrepeso en el personal docente universitario. Barquisimeto Estado Lara. Venezuela. Salud, arte y cuidado, 4(2), 20-31.
Canto-Osorio, F., Denova-Gutierrez, E., Sánchez-Romero, L. M., Salmerón, J., & Barrientos-Gutierrez, T. (2020). Dietary Inflammatory Index and metabolic syndrome in Mexican adult population. The American Journal of Clinical Nutrition, 112(2), 373-380.
del Moral-Trinidad, L. E., Romo-González, T., Figueroa, Y. P. C., Enríquez, A. B., Exsome, C. P., & Campos-Uscanga, Y. (2021). Potencial del índice de masa corporal como indicador de grasa corporal en jóvenes. Enfermería Clínica, 31(2), 99-106.
del Pilar Cruz-Domínguez, M., González-Márquez, F., Ayala-López, E. A., Vera-Lastra, O. L., Vargas-Rendón, G. H., Zarate-Amador, A., & Jara-Quezada, L. J. (2015). Overweigth, obesity, metabolic syndrome and waist/height index in health staff. Revista Médica del Instituto Mexicano del Seguro Social, 53(S1), 36-41.
Fahed, G., Aoun, L., Bou Zerdan, M., Allam, S., Bou Zerdan, M., Bouferraa, Y., & Assi, H. I. (2022). Metabolic syndrome: updates on pathophysiology and management in 2021. International Journal of Molecular Sciences, 23(2), 786.
García, M. V. D., Huitrón, G., & López, A. A. M. (2012). La reacción inflamatoria en la fisiopatogenia de la obesidad. CIENCIA ergo-sum, 19(1), 75-82.
Gasperín-Rodríguez, E. I., Gómez-Figueroa, J. A., Gómez-Miranda, L. M., Ríos-Gallardo, P. T., Palmeros-Exsome, C., Hernández-Lepe, M. A., ... & Bonilla, D. A. (2022). Body composition profiles of applicants to a physical education and sports major in Southeastern Mexico. International Journal of Environmental Research and Public Health, 19(23), 15685.
González-Chávez, A., Simental, L., Elizondo-Argueta, S., Sánchez-Zúñiga, J., Gutiérrez-Salgado, G., & Guerrero-Romero, F. (2008). Prevalencia del síndrome metabólico entre adultos mexicanos no diabéticos, usando las definiciones de la OMS, NCEP-ATPIIIa e IDF. Rev Med Hosp Gen Mex, 71(1), 11-9.
Gutiérrez, S. A. G., Orozco, G. E. M., Rodríguez, E. M., Vázquez, J. D. J. S., & Camacho, R. B. (2002). La grasa visceral y su importancia en obesidad. Revista de Endocrinología y Nutrición, 10(3), 121-127.
Khader, Y., Batieha, A., Jaddou, H., El-Khateeb, M., & Ajlouni, K. (2019). The performance of anthropometric measures to predict diabetes mellitus and hypertension among adults in Jordan. BMC public health, 19(1), 1-9.
Kuhnle G. G. (2012). Nutritional biomarkers for objective dietary assessment. Journal of the Science of Food and Agriculture, 92(6), 1145-1149.
Li, S., Ding, J., & Zhou, W. (2022). Visceral fat area and body fat percentage measured by bioelectrical impedance analysis correlate with glycometabolism. BMC Endocrine Disorders, 22(1),231
Martínez, J. G., Duque, D. A. S., Morejón, C. P., & Duque, P. D. (2019). Evaluación nutricional en docentes de la Universidad UTE de Quito. Nutrición clínica y dietética hospitalaria, 39(4), 155-161.
Marrodán, M. (2007). Limitaciones del IMC como indicador exclusivo de estado nutricional. Revista Argentina de Antropología Biológica, 9(1), 59.
Moreira, P. F. P., Dalboni, M. A., Cendoroglo, M., Santos, G. M. S., & Cendoroglo, M. S. (2013). Postprandial interleukin-6 response in elderly with abdominal obesity and metabolic syndrome. The journal of nutrition, health & aging, 17, 206-210.
Muñoz, M. G. M., Aguirre, F. J. O., de León Medrano, D. L., & Ochoa, C. (2016). El Índice cintura-talla como predictor del daño cardiovascular. Revista Cubana de Alimentación y Nutrición, 26(2), 13.
Oliveira, T. M. S., de Faria, F. R., de Faria, E. R., Pereira, P. F., Franceschini, S. C., & Priore, S. E. (2014). Nutritional status, metabolic changes and white blood cells in adolescents. Revista Paulista de Pediatria (English Edition), 32(4), 351-359.
Oumer, A., Ale, A., Tariku, Z., Hamza, A., Abera, L., & Seifu, A. (2022). Waist-to-hip circumference and waist-to-height ratio could strongly predict glycemic control than body mass index among adult patients with diabetes in Ethiopia: ROC analysis. Plos one, 17(11), e0273786.
Padilla, J. (2014). Relación del índice de masa corporal y el porcentaje de grasa corporal en jóvenes venezolanos. riccafd: Revista Iberoamericana de Ciencias de la Actividad Física y el Deporte, 3(1), 27-33.
Pajuelo Ramírez, J., Torres Aparcana, L., Agüero Zamora, R., & Bernui Leo, I. (2019, January). El sobrepeso, la obesidad y la obesidad abdominal en la población adulta del Perú. In Anales de la Facultad de Medicina (Vol. 80, No. 1, pp. 21-27). UNMSM. Facultad de Medicina.
Ryder, E., Mijac, V., Fernández, É., Palazzi, N., Morales, M. C., Connell, L., & Fernández, N. (2014). Esteatosis hepática, grasa visceral y alteraciones metabólicas, en individuos con sobrepeso/obesidad aparentemente sanos. Investigación Clínica, 55(1), 3-14.
Rodríguez, M. B., Guadarrama, R. G., & López, M. V. (2020). Prevalencia de obesidad según los indicadores: porcentaje de grasa corporal, índice de masa corporal y circunferencia de cintura. Nutrición clínica y dietética hospitalaria, 40(3).
Romero-Martínez, M., Shamah-Levy, T., Vielma-Orozco, E., Heredia-Hernández, O., Mojica-Cuevas, J., Cuevas-Nasu, L., & Rivera-Dommarco, J. (2021). Encuesta Nacional de Salud y Nutrición 2018-19: metodología y perspectivas. Salud Pública de México, 61, 917-923.
Romero-Martínez, M., Shamah-Levy, T., Barrientos-Gutiérrez, T., Cuevas-Nasu, L., Bautista-Arredondo, S., Colchero, M. A., ... & Lazcano-Ponce, E. (2023). Encuesta Nacional de Salud y Nutrición 2023: metodología y avances de la Ensanut Continua 2020-2024. salud pública de méxico, 65(4), 394-401.
Salazar Estrada, J. G., Torres López, T. M., Aranda Beltrán, C., & López Espinoza, A. (2016). Calidad de vida relacionada con la salud y obesidad en el personal docente universitario de Jalisco, México. Actual. nutr, 79-86.
Shukohifar, M., Mozafari, Z., Rahmanian, M., & Mirzaei, M. (2022). Performance of body mass index and body fat percentage in predicting metabolic syndrome risk factors in diabetic patients of Yazd, Iran. BMC Endocrine Disorders, 22(1), 216.
Smith, S., & Madden, A. M. (2016). Body composition and functional assessment of nutritional status in adults: a narrative review of imaging, impedance, strength and functional techniques. Journal of human nutrition and dietetics, 29(6), 714-732.
Torres Zapata, Á. E., Zapata-Gerónimo, D., Rivera-Domínguez, J., & Acuña-Lara, J. P. (2018). El obeso de peso normal. Revista salud pública y nutrición, 17(2), 25-31.